Tesla Q2'19 Earnings Forecast
I wasn't planning on making a post about this, but I'm seeing a lot of forum posts and videos popping up with predictions and financial models. Although these aren't necessarily less accurate than my own, they are definitely less detailed. I've been doing quite a bit of research and analysis into Tesla as of late, mostly in preparation for a future blog post. In the process I've spent a lot of time making various spreadsheets, and I feel like I may as well share the parts that are relevant to next week's Q2'19 earnings report. So here goes.
If you're on a PC it might be easier to follow along if you open one of these spreadsheets:
Q2'19 Earnings Forecast PDF
Q2'19 Earnings Forecast Numbers
Q2'19 Earnings Forecast Excel

This spreadsheet breaks down the deliveries into US and non-US. This is important, because the ASPs for the M3 are currently very different in the US compared to the rest of the world. When Tesla enters a new market, it always starts by delivering only the most expensive variants first. Tesla is already delivering the M3 Short Range Plus (M3 SR+) version in large quantities in the US, which drives down the ASP, but Tesla only just started delivering the M3 overseas this year. As a result Tesla still delivers almost exclusively Long Range (LR) and Performance M3s to non-US countries at much higher ASPs.
To understand how I estimated the ASPs above, let's take a look at this next spreadsheet.


If you're on a PC it might be easier to follow along if you open one of these spreadsheets:
Q2'19 Earnings Forecast PDF
Q2'19 Earnings Forecast Numbers
Q2'19 Earnings Forecast Excel
Automotive Revenue & Margins
The delivery numbers were taken from Tesla's Q2'19 Deliveries announcement. To explain to you how I estimated the rest of the numbers, I need the help of two more spreadsheets.
This spreadsheet breaks down the deliveries into US and non-US. This is important, because the ASPs for the M3 are currently very different in the US compared to the rest of the world. When Tesla enters a new market, it always starts by delivering only the most expensive variants first. Tesla is already delivering the M3 Short Range Plus (M3 SR+) version in large quantities in the US, which drives down the ASP, but Tesla only just started delivering the M3 overseas this year. As a result Tesla still delivers almost exclusively Long Range (LR) and Performance M3s to non-US countries at much higher ASPs.
To understand how I estimated the ASPs above, let's take a look at this next spreadsheet.
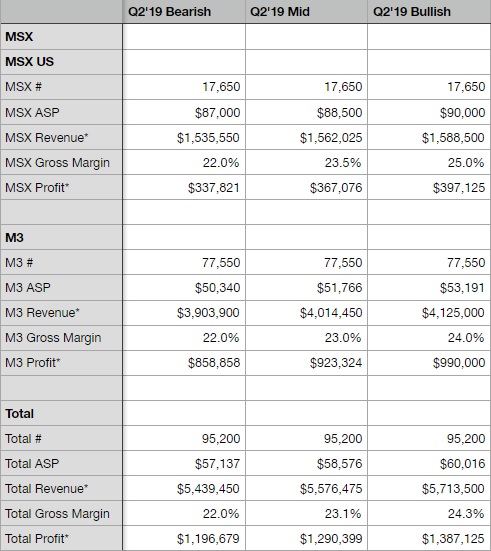
Delivery #s, revenue, and profit are hard data, and were taken from Tesla's official reports. Green fields are estimations. M3 ASPs & Margins are automatically calculated by spreadsheet based off of MS&X estimations.
This spreadsheet shows Tesla's automotive results from the past few years and tries to estimate gross margins for individual models. This is far from an exact science and involves a lot of guesswork, but it's the best methodology I've been able to think of.
First it has to be noted that there are a lot of weird quarters. The margin for Model S&X was strangely high in Q3'16, ASPs for MS&X seem to fluctuate a lot, and no matter what ASPs you fill in in Q1'19, something is definitely not right in that quarter. The 15% MS&X margin in Q1'19 makes a lot of sense though in my opinion, because Tesla retooled their production lines in preparation of Raven update.
Now let's go back to the Automotive Geographical spreadsheet:
Here is my rationale for all the green estimations:
- Model S&X ASP. I think Q1'19 was definitely way off and very weird. Like I said, no matter what numbers you enter, something is off. I also think that although not impossible (Autopilot is standard since April'19), it's unlikely to go back to the ~$90.000 that used to be the norm, due to the Q1'19 price cuts. Therefore I entered a range between 87-90k.
- Model S&X Margin. The 15% in Q1'19 was due to retooling, and low volume (fixed costs spread out over smaller # of vehicles), but I think it will take a little longer before we'll go back to ~27% Gross Margins for S&X. My guess is that Q2 was around 22-25%.
- Model 3 ASP US. Tesla talked about this in their Q1'19 conference call, and said that they were just barely below $50.000 at the time.
- Model 3 ASP Non-US. This is a bit more of a guess. M3 ASPs in Q3'18 and Q4'18 were 57-60k, in Q1 prices were lowered, but in Q2 Autopilot became standard. Considering the LR M3 started at ~50k in Q2, I think 53.5k - 57.5k is a decent range. And to be honest, I think it's more likely to be on the higher end of this than the lower end.
- Model 3 Margin. These might look very high considering Q1 was at around 20%, however, Autopilot became standard in Q2, volume shot up by over 50% (fixed costs spread out over bigger # of vehicles), and Tesla just announced they're lowering prices, which to me indicates very strong margins. Therefore, I think 22% is going to be on the lower end, with a chance of up to ~24% Model 3 gross margin.
Like I showed above, when you fill in these margins and ASPs into the overall automotive spreadsheets, you get the following results:
Income Statement
Next, let's create an income statement around these automotive numbers.
Most important estimations are once again in green. I think most of these are fairly self explanatory, but here are a few brief comments:
- Energy should be slightly higher than Q1 due to seasonality.
- Tesla is losing a lot of money on service each quarter.
- I reckon interest expense will be on the low side, because they just paid off a massive amount of debt in Q1.
I think overall EPS will be on the high side of this range. I think it's much more likely that we'll hit the bull case than the bear case, and on average I think it'll be somewhere in between the mid and bull case. Maybe a small EPS of $0.20 or $0.25.
So earnings are shaping up to be quite strong, but I think cash flows are going to be the real surprise next Wednesday.
Cash Flows
If you open the spreadsheet file, you'll find Cash Flows all the way back to Q1'16. Some of this data is very helpful in getting a feel for some of the numbers. A few brief comments about some of the green estimations:
- Changes in operating assets and liabilities will be very high, due to the reduction in inventory. Tesla sold about 7.500 more cars than they produced in Q2, all of these came from inventory and will significantly contribute to Tesla's cash position at the end of Q2. It's definitely on the high end of the 200-400k range, maybe even over 400k, but I adjusted the inventory numbers a little bit so that the overall changes in assets and liabilities are realistic.
- I think Giga 3 capex will start to seriously ramp up in Q3, because reports of production lines being installed only just started to appear, but I could be wrong, and capex could have been higher in Q2 than these estimations.
- I'm expecting they paid back some debt with some of the money they got from their public offering, because their cash position is honestly quite enormous.
Summary of my Q2'19 earnings forecast
- Automotive Revenue = 5.45B ~ 5.7B
- Automotive Gross Margin = 22% ~ 24%
- Total Revenue = 6.5B ~ 6.85B
- Gross Profit = 1.05B ~ 1.4B
- Income From Ops = -50M ~ +300M
- GAAP EPS = -$1.50 ~ $1.00
- Free Cash Flow = 400M ~ 1.5B
- Cash EoQ = 5.1B ~ 6.7B
Comments
Post a Comment